
Holiday storms: which of your sites and routes are exposed
A winter storm never hits a whole network evenly. Know early which DCs and corridors it touches, and turn that into owned, dated actions before trucks stall.
On this page
Four days before the holiday weekend, a late-December ice storm shows up in the forecast, crossing three states in a band a few hundred miles wide. By lunch it is on every news site. The question in the operations channel is narrower and harder to answer: which of our buildings are in that band, and which of our routes run through it?
This piece goes deep on one chain from our guide to tracing a global disruption to your business: how a storm moves from forecast to corridor traffic to specific DCs and routes, and how Atlas One shows that exposure early enough to act on.
Why storms are harder than they look
A forecast describes an area. Your network is a set of points and lines: buildings, and the corridors between them. The two rarely line up neatly. A DC can sit just outside the storm and still lose the interstate that feeds it. A route can start and end in clear weather and cross a county that is closed for a day. And when the ice melts, the flood warnings that follow are a second wave that few teams are watching for.
The chain of impact
The figures below are illustrative, built around a composite company: a housewares and apparel distributor with three DCs and a set of regional delivery routes going into its biggest week of the year.
The forecast firms up (planning). The ice storm is now expected to cross the corridor between the Central DC and the Northeast DC on Friday and Saturday. Nobody owns turning it into a network view.
Corridor traffic slows, then closes (transportation). Sections of the interstate between the two buildings close for most of a day. Linehaul between them runs one to two days late, and replenishment for the Northeast DC is stuck behind it.
The site itself is exposed (DC operations). The Northeast DC sits inside the icing zone. Staff can't get in safely, and receiving and outbound lose two shifts.
Holiday orders miss their promise (fulfillment and service). In this scenario, about 4,000 orders from the Northeast DC ship a day or more late.
Recovery gets expensive (operations and finance). Weekend overtime and expedited shipping to catch up add an illustrative $38,000.
Credits and cancellations follow (sales and finance). Missed holiday deliveries turn into an illustrative $50,000 in credits and cancellations, found in the January close.
How teams catch it today
Usually one planner watches the national forecast and compares it to a mental map of the network. That works until the forecast shifts, which it does every few hours.
Weather and roads live in different places. The forecast says where ice will fall. Road status says which segments are closed. Combining them for your routes is manual work, redone with every update.
Corridor exposure is easy to miss. Teams check whether a building is in the storm. They are less likely to notice that the building's main inbound route crosses it.
The second wave goes unwatched. Once the storm passes, attention moves on, just as thaw and flood warnings start to appear around the same sites.
Response runs on group chat. Who is rerouting, and by when, lives in a thread that scrolls away.
So the first hard signal is often a truck that didn't arrive or a shift that didn't show up, which is two or three steps into the chain.
How Atlas One catches it
Atlas One works from a profile your team has confirmed: the sites, warehouses and DCs you run, and the routes and corridors that connect them. It watches outside sources against that profile, not the whole map.
Weather and flood are matched to your sites. When the ice storm's footprint covers the Northeast DC, that DC is named as exposed, not just the region.
Traffic and routing are matched to your corridors. Closures and slowdowns on the interstate between the Central and Northeast DCs are tied to that specific route.
Related evidence becomes one situation. The icing forecast, the corridor closures and the site exposure are grouped into a single situation, ranked and cited to its sources, so the team can see why it is flagged.
Watches follow the storm. A watch on the DC and the corridor sends alerts when the evidence changes: the track shifts, a closure lifts, or flood warnings appear after the thaw.
"What if" questions test the next move. "What if the corridor is closed for 48 hours?" or "Which other sites depend on this route?" are answered against the same confirmed sites and routes.
From there, the situation becomes owned work in the Action Queue. Each action has an owner and a date and is tracked through to done: transportation confirms an alternate route, the Northeast DC manager adjusts shift plans, planning pulls forward replenishment from the Central DC.
Atlas One doesn't see your orders. The order and credit figures in this article are a scenario. What it gives you is the early, sourced answer to which sites and routes are exposed, which decides whether those figures happen.
Illustrative example
Same composite distributor, same storm, illustrative numbers.
Before
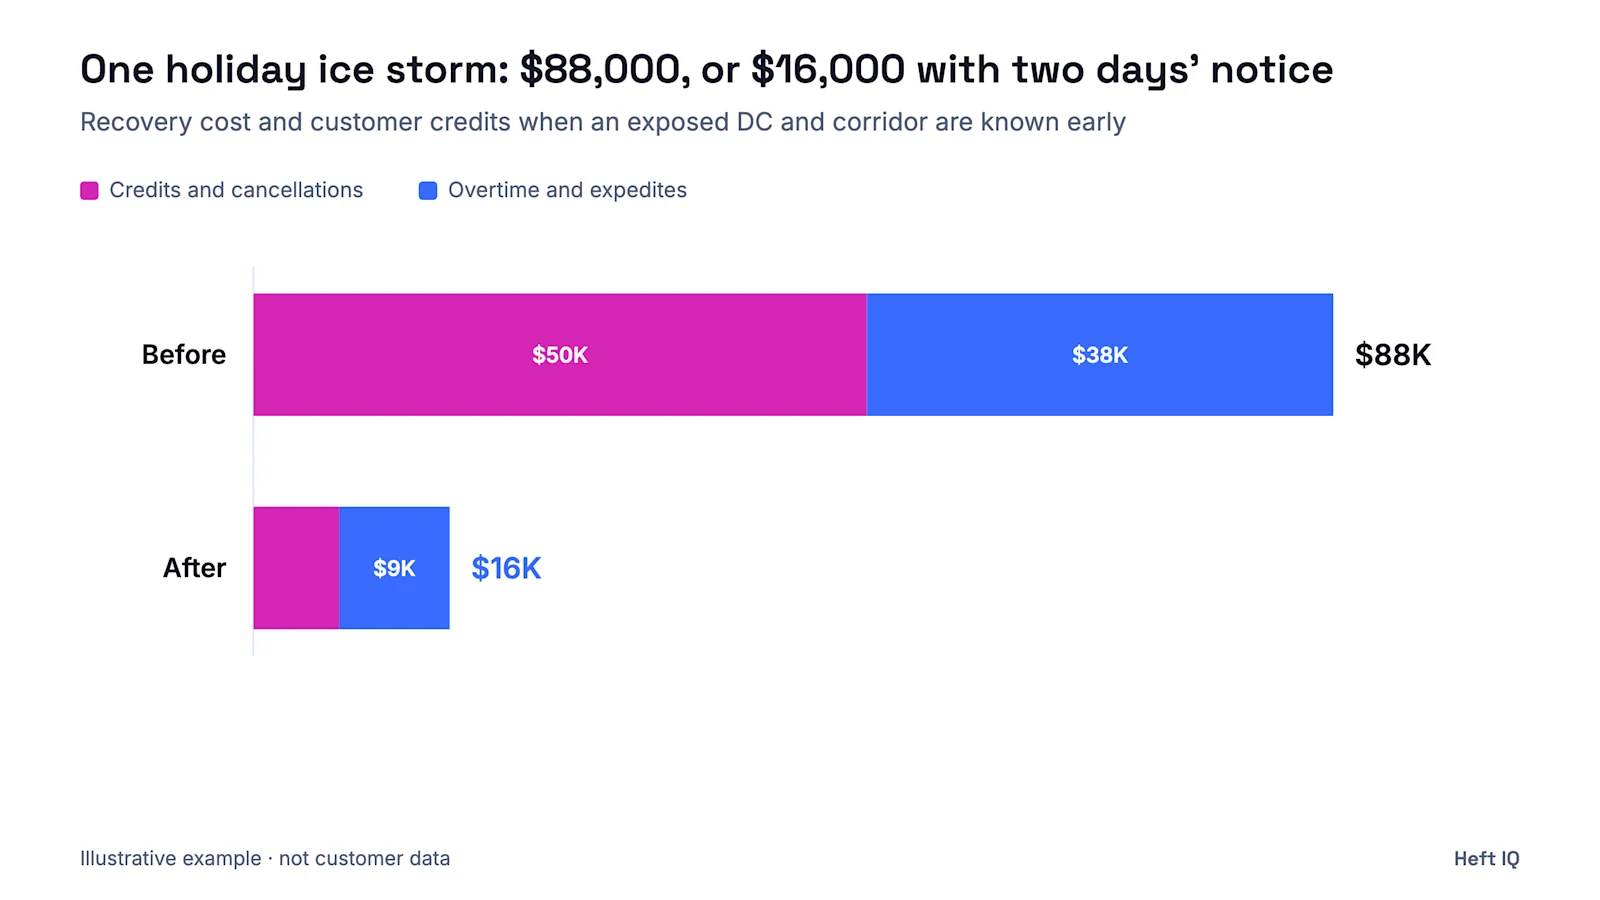
The planner flagged the storm on Wednesday as "possible impact in the Northeast." Nobody connected it to the interstate between the Central and Northeast DCs until linehaul stalled on Friday. Two shifts were lost at the Northeast DC. Result: about 4,000 late orders, $38,000 in overtime and expedites, and $50,000 in credits and cancellations, or about $88,000 in total.
After
On Tuesday, Atlas One matched the forecast to the Northeast DC and its main inbound corridor and grouped them into one ranked, cited situation. A watch went on both. The Action Queue carried three owned, dated actions due Wednesday: pull forward two days of replenishment from the Central DC, confirm an alternate route, and move the Northeast DC's weekend shifts to the days before the storm.
When the corridor closed Friday, the building already had its stock. On Sunday a flood alert on the same corridor kept the alternate route in place for one more day. In this scenario, late orders fell to about 700, overtime and expedites to $9,000, and credits to $7,000, roughly $72,000 better than the "before" version of the same week.
For the wider view of how outside events reach your business, read the pillar guide. To see how Atlas One matches weather, flood and traffic to the sites and routes you have confirmed, visit the Atlas One product page.