
Illustrative scenario: a 3PL's first 90 days with CargoCore
Follow a composite eight-warehouse 3PL as cost to serve, margin signals and owned actions turn $159,000 of illustrative margin at stake into tracked results.
On this page
This is an illustrative scenario built on a composite company, not a customer story. It follows a regional 3PL running eight warehouses through its first 90 days with CargoCore. Volume was growing and peak was close, but leadership could see revenue by brand without seeing what each brand actually cost to serve. All figures here are illustrative.
The company
The composite 3PL runs eight warehouses across three regions and fulfills for about 40 ecommerce brands, from apparel and beauty to supplements and home goods. Most brands pay a mix of per-order pick fees, storage and activity fees for kitting, inserts and special projects. Finance closes each month with a profit-and-loss by customer, and each building runs on its own daily numbers.
The owner, the COO and the CFO kept circling one question they couldn't answer: which brands and SKUs make money once labor, freight, storage and exceptions are counted, and where is the gap coming from? By the time the monthly close hinted at an answer, the month was already gone.
What was connected
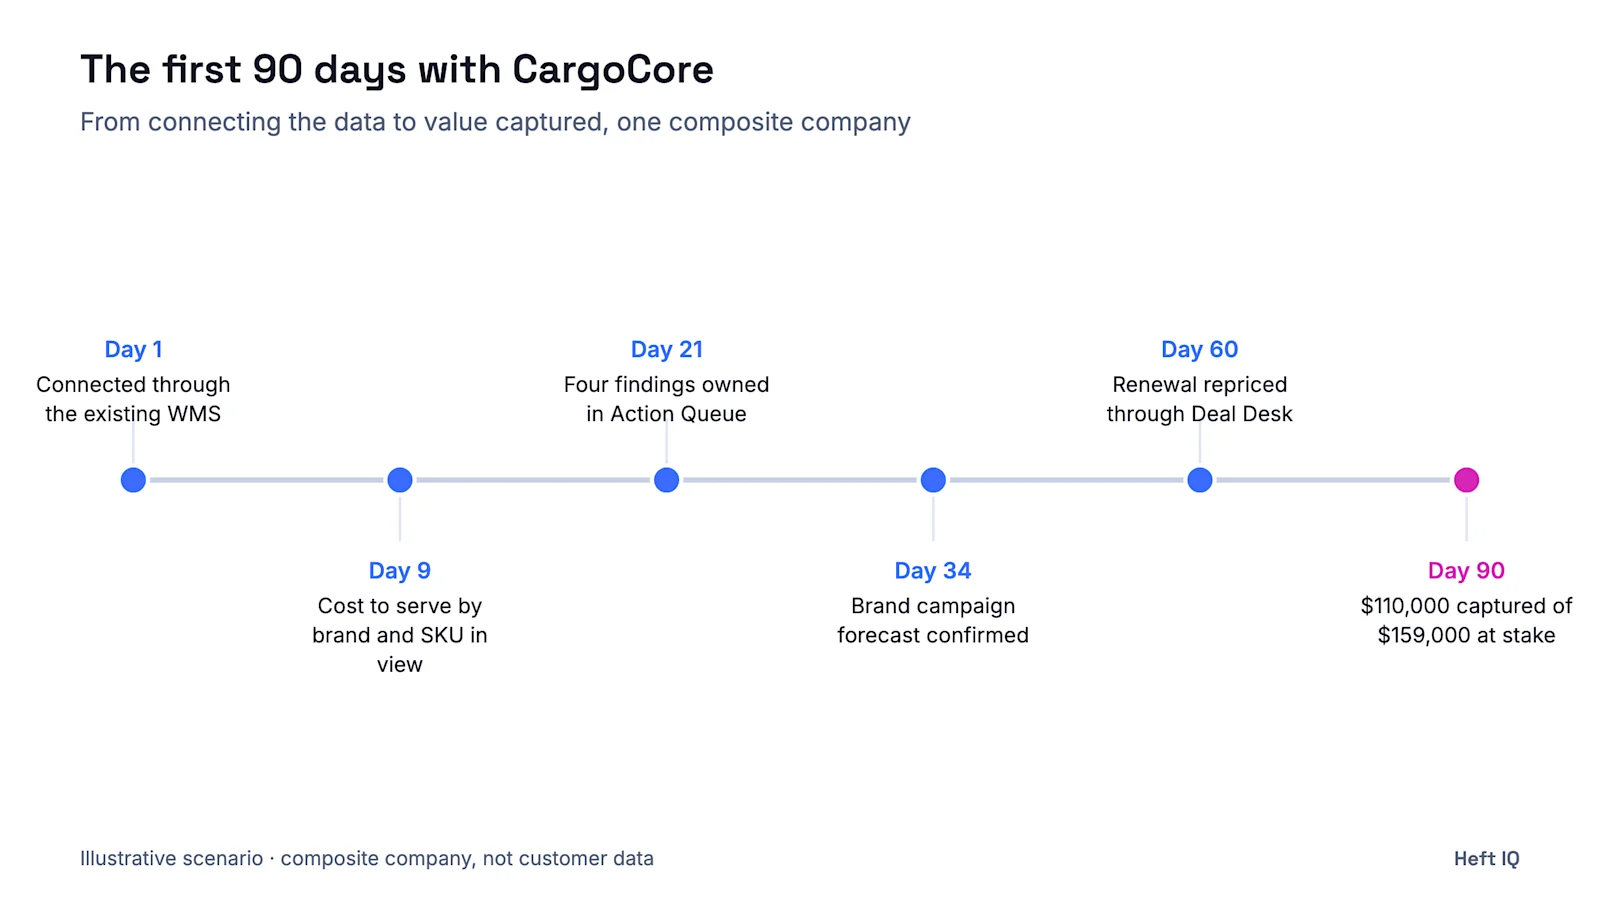
CargoCore was connected through the WMS the 3PL already runs. From there it reads the activity that drives cost to serve: orders and shipments, receiving against ASNs, labor, freight, storage and exceptions.
Three views did most of the work in the first month: the Executive Command Center for cost to serve, drilling from region to warehouse to brand to SKU; the Ops Command Center for alerts ranked by urgency and dollars, each with an owner role; and the Action Queue, where findings become owned, dated actions.
What surfaced in the first 30 days
Kitting and inserts done but never billed
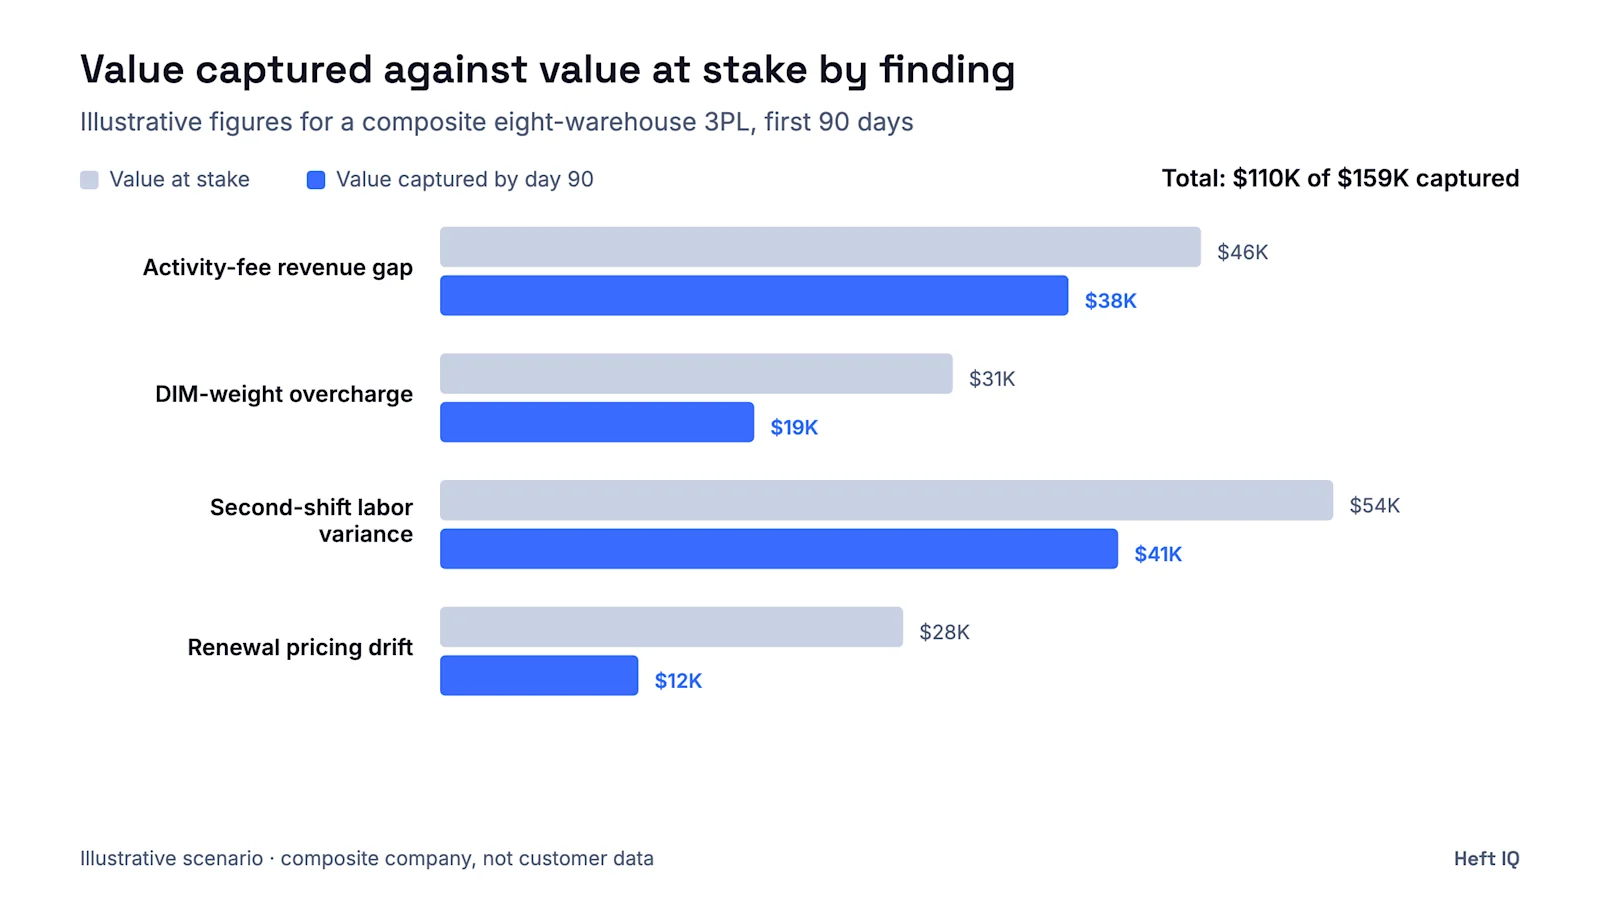
In the Executive Command Center, labor for two subscription brands kept climbing while their activity-fee revenue stayed flat. CargoCore flagged an activity-fee revenue gap: kitting and gift inserts requested by email during a promotion were being done on the floor but never reached the invoice. Illustrative value at stake: $46,000 over the quarter. Owner: the controller, working with each brand's account manager.
Oversized cartons on a fast-moving SKU set
For one home goods brand, freight per order at three buildings ran well above the same brand's orders elsewhere. The DIM-weight overcharge signal traced it to a handful of SKUs packed in a carton one size too large, which pushed those shipments into a higher dimensional weight. Illustrative value at stake: $31,000. Owner: the general managers of the three buildings.
Second-shift labor running over plan
The Ops Command Center kept ranking labor gap and cutoff risk alerts near the top for one building's second shift. CargoCore's labor variance view showed hours per order there well above plan, driven by pick paths built for last year's SKU mix and by overtime spent making carrier cutoffs. Illustrative value at stake: $54,000. Owner: that building's warehouse manager, working tasks through Mobile Ops.
A renewal priced on an order profile that no longer existed
One of the largest brands was coming up for renewal. Deal Desk had flagged drift between the approved deal and actual activity, and its margin preview showed why: the rates assumed more units per order than the brand now shipped, so pick fees no longer covered the labor. Illustrative value at stake: $28,000 over the quarter. Owner: the VP of sales, with ops review before approval.
Who owned what
Every finding became an owned, dated action in the governed Action Queue. Dollar-valued alerts from the Ops Command Center flowed into the same queue, so the COO reviewed one list instead of four reports. Each action carried an owner, a due date and the value at stake, and stayed open until the work was done.
Activity-fee gap: the controller owned a billing correction for the two brands, due by the next invoice run. The account managers owned confirming which requests were billable from then on.
DIM-weight: each general manager owned a carton change for the flagged SKUs, due within two weeks. The tasks reached the floor through Mobile Ops.
Labor variance: the warehouse manager owned a re-slot of the top movers and a revised second-shift plan. A supervisor tried to dismiss one recurring task as noise, but dismissing a task in Mobile Ops requires approval, so it went to the manager, who kept it open.
Renewal pricing: the VP of sales owned a revised quote, moved from draft through ops review to approval in Deal Desk.
Tracked to done meant something specific here. An action closed when the work was finished, not when someone replied to an email about it, and the weekly review showed which actions were late and who held them.
Days 31 to 90: what changed
Around day 34, one of the 3PL's brands submitted a campaign forecast for a holiday promotion through the CargoCore brand portal. The assigned account managers were emailed, the 3PL assigned warehouses, and the staffing-gap detector flagged that the building with the second-shift problem would be short of labor in the promotion's first week. The COO confirmed the forecast with a change, moving part of the volume to a sister building. It was the first promotion in a year that didn't arrive as a surprise.
By day 90, the illustrative results looked like this:
Activity-fee gap: $38,000 captured of $46,000 at stake. Two months of past work were billed. The balance was older activity the brands disputed, and the controller chose not to pursue it.
Labor variance: $41,000 captured of $54,000 at stake, as second-shift hours per order moved most of the way back to plan after the re-slot.
Renewal pricing: $12,000 captured of $28,000 at stake. The new rates took effect on day 60, so only part of the quarter reflected them. The rest carries into the next quarter.
DIM-weight: $19,000 captured of $31,000 at stake. This was the miss.
Two buildings switched cartons inside the deadline. The third, the same building with the second-shift problem, kept running out of the smaller carton during receiving surges and fell back to the larger one for most of a month. The action stayed open with a new owner, the building's inventory lead, and a due date tied to the carton reorder.
In total, $110,000 captured of $159,000 at stake in the first 90 days.
What made the difference
None of these findings was invisible before. Billing knew some requests came in by email, the general managers knew freight was up, and everyone knew second shift was tight. What changed was that each one arrived with a dollar value, a brand or SKU attached and an owner, early enough to act inside the quarter rather than at month-end close.
The findings were also connected. The building with the labor problem was the one the campaign forecast flagged and the one where cartons ran short. Seeing cost to serve by brand and SKU next to ranked operational alerts let the COO treat it as one building's problem instead of three unrelated reports. Costs that couldn't be traced to a SKU stayed on their own line, so the CFO wasn't debating numbers that had been spread evenly across every product.
Finally, the Action Queue gave leadership one question to ask each week: what is open, who owns it, and what is it worth? That question replaced the monthly hunt for where margin went.
See how CargoCore connects cost to serve, operational alerts and owned actions for a multi-warehouse 3PL. For the wider pattern behind these findings, read where peak season quietly drains 3PL margin.